3 minutes
Selfhosted ‘Google Analytics’ alternative setup
It was time to get a little insight in my selfhosted blog. My aim was to create a kind of selfhosted ‘Google Analytics’ using a combination of nginx, Loki and Promtail.
Logging setup
I host my blog on a k3s cluster using nginx. To collect logs from the containers, I use Promtail to forward them to my Loki instance. To ensure all container logs are gathered efficiently, I deployed Promtail as a daemonset across the worker nodes in my cluster.
Nginx
Nginx is my web server of choice to deploy my small website. I can configure it to store certain data elements that I need. To keep it simple, only the most important elements are logged and will be formatted to JSON:
| Variable | Description |
|---|---|
remote_addr |
Client IP |
time_local |
Local time |
request |
Full request |
status |
Status code |
http_referer |
Referer pages |
http_user_agent |
HTTP clients / user agents |
http_x_forwarded_for |
Real IP |
The nginx.conf inside my containers:
user  nginx;
worker_processes  auto;

error_log  /var/log/nginx/error.log notice;
pid        /var/run/nginx.pid;

events {
    worker_connections  1024;
}

http {
    include       /etc/nginx/mime.types;
    default_type  application/octet-stream;

    log_format  main  '$remote_addr [$time_local] "$request" '
                      '$status $body_bytes_sent "$http_referer" '
                      '"$http_user_agent" "$http_x_forwarded_for"';

    access_log  /var/log/nginx/access.log  main;

    set_real_ip_from 10.0.0.0/8;
    real_ip_header X-Forwarded-For;

    sendfile        on;
    keepalive_timeout  65;
    include /etc/nginx/conf.d/*.conf;
}
Promtail
The deployment of Promtail is done using a daemonset as mentioned earlier. This makes sure that every node has a Promtail pod running ready to ship the logs of containers running on that specific node.
I installed the kubernetes components using the official docs.
And ofcourse the configMap for the Promtail configuration and connection to Loki:
--- # configmap.yaml
apiVersion: v1
kind: ConfigMap
metadata:
  name: promtail-config
  namespace: logging
data:
  promtail.yaml: |
    server:
      http_listen_port: 9080
      grpc_listen_port: 0

    clients:
    - url: http://192.168.129.160:3100/loki/api/v1/push

    positions:
      filename: /tmp/positions.yaml
    target_config:
      sync_period: 10s

    scrape_configs:
    - job_name: pod-logs
      kubernetes_sd_configs:
        - role: pod
      pipeline_stages:
        - docker: {}
      relabel_configs:
        - source_labels:
            - __meta_kubernetes_pod_node_name
          target_label: __host__
        - action: labelmap
          regex: __meta_kubernetes_pod_label_(.+)
        - action: replace
          replacement: $1
          separator: /
          source_labels:
            - __meta_kubernetes_namespace
            - __meta_kubernetes_pod_name
          target_label: job
        - action: replace
          source_labels:
            - __meta_kubernetes_namespace
          target_label: namespace
        - action: replace
          source_labels:
            - __meta_kubernetes_pod_name
          target_label: pod
        - action: replace
          source_labels:
            - __meta_kubernetes_pod_container_name
          target_label: container
        - replacement: /var/log/pods/*$1/*.log
          separator: /
          source_labels:
            - __meta_kubernetes_pod_uid
            - __meta_kubernetes_pod_container_name
          target_label: __path__
Loki
My Loki instance is running on my “monitoring” VM alongside Grafana and Prometheus. Once Loki is added as a datasource to Grafana, then I can start querying logs from Grafana.
Dashboard
Now that all the logs can be queried inside Grafana, setting up a dashboard was pretty straightforward. For now I created a simple dashboard with a couple of statistics. This needs to be refined as there are still a lot of request logs from scrapers, images, certain files,…
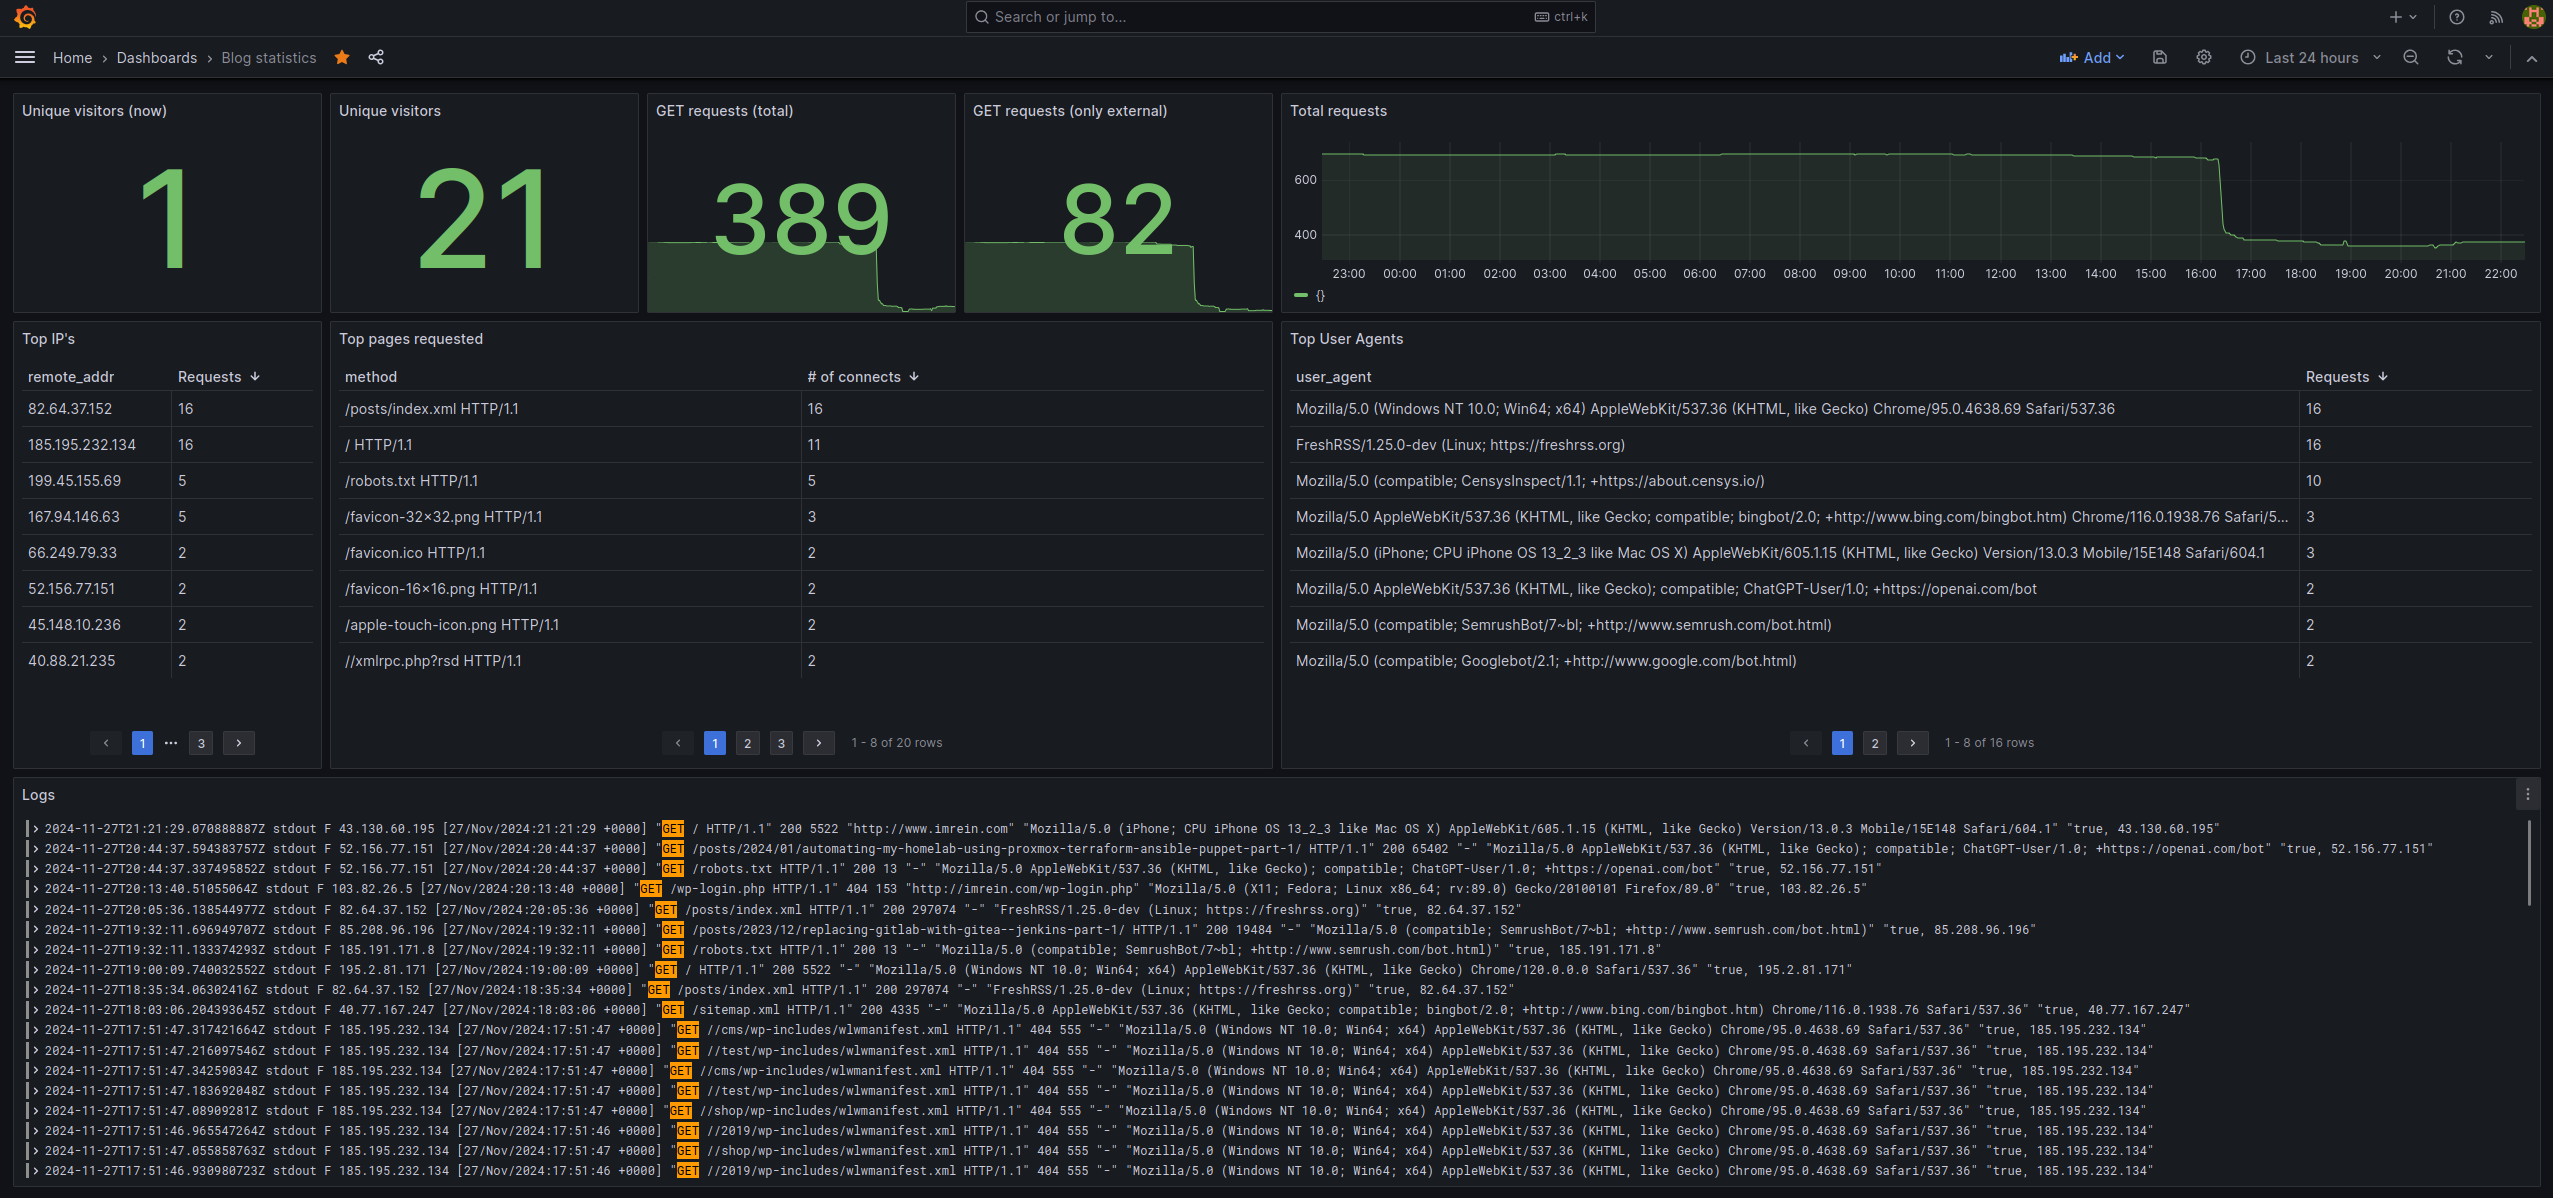
The next step will be to clean up the logs from all the scrapers and bots.